
Did the Ad Do That? Dr Pepper’s Fansville and the Challenge of Measuring Advertising
It might have been more fun to show this ad and article earlier in the college football season, but then we wouldn’t have the latest data on this highly effective campaign.
Dr Pepper’s Fansville is back for Season 9, and a fresh round of brand-tracking data makes it a good case for two chapters that don’t always get to share a class period: marketing research and measuring advertising effectiveness. Your students will enjoy the ad, and the numbers give them something to argue about. I recommend showing the ad first (below), then bringing in the data.
Article Summary
A short YouGov article reports that Dr Pepper’s brand metrics rose sharply around the August 27 premiere of “Fandom Never Sleeps,” the ninth season of the campaign. YouGov’s BrandIndex surveys U.S. adults every day. Dr Pepper’s Buzz score (a net measure of whether people recently heard something positive or negative about the brand) went from 11.1 in mid-August to a peak of 21.6 on September 1. Purchase Intent (the share of people who say Dr Pepper is the beverage brand they would be most likely to buy) climbed from a pre-launch average of about 5.5% to 12.6%, and was still at 11.6% on September 8. That is more than double.
The more interesting story for a classroom is what the article doesn’t emphasize. Both metrics started rising before the ad premiered. Buzz was already at 16.6 the day before launch, and these are two-week moving averages, so the lift began well before August 27. College football was starting up, and Dr Pepper’s own announcement describes a campaign that runs across TV, digital, social, radio, out-of-home, creator partnerships, merchandise drops, and fan promotions. So what caused the jump? YouGov chooses its words carefully, suggesting the launch “coincides” with the gains. That gives students a great chance to separate correlation from causation. It’s also worth noting that YouGov sells this data. The article is part research report, part sales pitch.
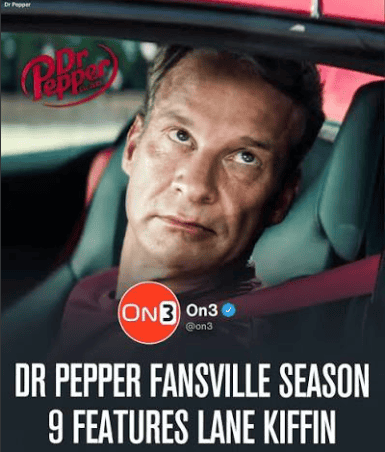
A word about the ad itself. Some of it is inside baseball. Season 9 plays on coaching rumors, the transfer portal, conference realignment, and other storylines college football fans argue about all week. If you don’t follow the sport, a few jokes will go right past you, and the same goes for some of your students. That’s fine, because Dr Pepper isn’t writing for them. Fansville runs during college football broadcasts, where the audience gets every reference. That’s how targeting works: pick the market, then speak its language. Ask your class who laughed and who looked puzzled, and you have a segmentation example sitting right in the room.
Claude was used to develop a first draft of this blog post.
Relevant Chapters in Essentials of Marketing
The article is a good example of syndicated research. YouGov collects the same data on thousands of brands, then repackages, and sells it to many clients (Chapter 7, secondary data and syndicated research). The methodology note gives the exact question wording, the sample size (about 1,100 to 1,200 per reading), and how the data was weighted to match Census targets, which makes it useful for discussing populations, samples, and data quality (Chapter 7, Step 4: Interpreting the Data). The main event is Chapter 15 (measuring advertising effectiveness). The chapter argues that it is hard to credit results to advertising because other parts of the marketing mix and outside factors also move the numbers, and that brand-building campaigns should be judged against their objectives with survey measures, not short-term sales alone. Fansville is now in its ninth season, which also makes it a good discussion of reminder versus competitive advertising (Chapter 15, types of advertising). As a secondary connection, the campaign shows the three basic promotion objectives and integrated marketing communications, and the inside-baseball humor (the transfer portal and Lane Kiffin story among others, football fans, the target here, will get) is a good illustration of encoding and decoding in the communication process (Chapter 13).
Class Discussion Ideas
I’d run this in two parts. Show the ad and talk about who it’s for and what it’s trying to do. Then put the numbers on the screen and ask the obvious question: did the ad cause this? The data is simple enough to put on one slide:
| Date | Buzz (net score) | Purchase Intent |
| Pre-launch (early/mid Aug.) | 11.1 (Aug. 15) | about 5.5% (average) |
| Aug. 26 | 16.6 | — |
| Aug. 27 (premiere) | 18.0 | 9.0% |
| Aug. 31 | 21.0 | — |
| Sept. 1 (peak) | 21.6 | 12.6% |
| Sept. 8 | 20.9 | 11.6% |
In-Class Activities
- Name That Objective. Show the ad before revealing any data. Small groups decide whether Fansville is trying to inform, persuade, or remind, and write one specific, measurable objective the campaign might have. Groups share, then you reveal the YouGov data and ask whether these metrics match the objectives they wrote. (Chapters 13 and 15)
- Read the Chart. Give students the table above, perhaps copying it to a PowerPoint slide, and have them sketch the two lines, then mark August 27. What do they notice about the timing? Ask them to list everything besides the ad that could have moved these numbers in late August. This works well as a think-pair-share before a whole-class discussion. (Chapters 7 and 15)
- Design a Better Study. Teams act as Dr Pepper’s research manager and propose a study that would isolate the campaign’s effect better. Push them toward ideas like regional holdout markets, comparing college football fans to non-fans, benchmarking against Coke and Pepsi over the same period, or linking ad exposure to store sales data. Each team gets two minutes to pitch its design, and the class votes on the most convincing one. (Chapters 7 and 15)
- Who Gets the Joke? After the ad, take a quick show of hands: who caught most of the references? Use the split to discuss targeting and encoding/decoding. Then have groups outline a similar campaign for a different fan base (the NBA, the Premier League, Formula 1) and identify the inside jokes that audience would get. (Chapter 13)
Discussion Questions and Instructor Notes
- What do YouGov’s Buzz and Purchase Intent scores measure, and how does YouGov collect the data? (Chapter 7)
- Answer: Buzz is a net score based on whether respondents heard something positive or negative about the brand in the past two weeks, from news, advertising, or friends and family. Purchase Intent is the percentage who pick Dr Pepper as the beverage brand they would be most likely to buy. Both come from daily online surveys of U.S. adults and are reported as two-week moving averages. Students should notice these are questioning methods that measure attitudes and stated intentions, not actual purchases.
- YouGov BrandIndex is syndicated research. Why would Dr Pepper pay for data its competitors can buy too? (Chapter 7)
- Answer: Syndicated research is much cheaper than running a daily national survey on your own, because many clients share the cost. Because it tracks thousands of brands the same way, it also lets Dr Pepper benchmark against Coca-Cola, Pepsi, and others. The competitive edge comes from how fast and how well a firm uses the data, not from having exclusive access. Some students may argue that a firm needs its own primary research too, and that’s a fair point.
- The sample is roughly 1,100 to 1,200 U.S. adults, weighted to match Census demographics. Is that the right population for judging Fansville? (Chapter 7)
- Answer: For tracking the overall brand, a representative sample of U.S. adults is reasonable. But Fansville targets college football fans, who are a subset of that population. If the campaign works well with fans, the effect may be diluted in a general-population sample. Then again, a jump this large showing up in the general population is notable. A stronger analysis should look separately at respondents who follow college football.
- Buzz and Purchase Intent both started rising before the ad premiered on August 27. Does this data show that the campaign worked? (Chapter 15)
- Answer: Not on its own. The early rise suggests other forces were at work, such as the start of college football season, pre-launch publicity, other Fansville promotion, or changes elsewhere in Dr Pepper’s marketing mix. Competitor activity (or a lack of it) could matter too. This is exactly the problem Chapter 15 describes: advertising rarely works in isolation, so it is hard to give it credit for a result. Still, the gains held through early September, which is consistent with the campaign contributing something. Good answers will avoid both “it proves it worked” and “it proves nothing.”
- Fansville is in its ninth season. Is it pioneering, competitive, or reminder advertising? (Chapter 15)
- Answer: It isn’t pioneering, because everyone knows what a soft drink is. A strong case can be made for reminder advertising: it keeps Dr Pepper top of mind and ties it to a ritual its fans already care about. But in a category where Coke and Pepsi are always fighting for share, it also has a competitive job of building selective demand among fans. Students may conclude it does both, and that’s a defensible answer.
- Much of the humor in “Fandom Never Sleeps” is “inside baseball.” Use the communication process to explain why that might be a smart choice, and identify the risk. (Chapter 13)
- Answer: Communication works when the receiver decodes the message the way the source encoded it, which requires a shared frame of reference. College football fans share that frame, so the jokes land and signal that Dr Pepper “gets” them. Because the ads run on college football broadcasts, most viewers are in on the joke. The risk is that non-fans who see the ad on social media or elsewhere may find it confusing, but that’s an acceptable trade-off when the brand is chasing a specific target market.
- If you were Dr Pepper’s research manager, how would you design a study to better measure what Fansville accomplished? (Chapters 7 and 15)
- Answer: Strong answers will propose some kind of comparison or control. Options include comparing markets with heavy versus light ad exposure, tracking college football fans separately from non-fans, comparing Dr Pepper’s trend with Coke’s and Pepsi’s over the same weeks, or matching survey results to retail sales data. Students should also connect the measures back to the campaign’s objectives. If the goal is long-term brand preference, a few weeks of data won’t tell the full story.